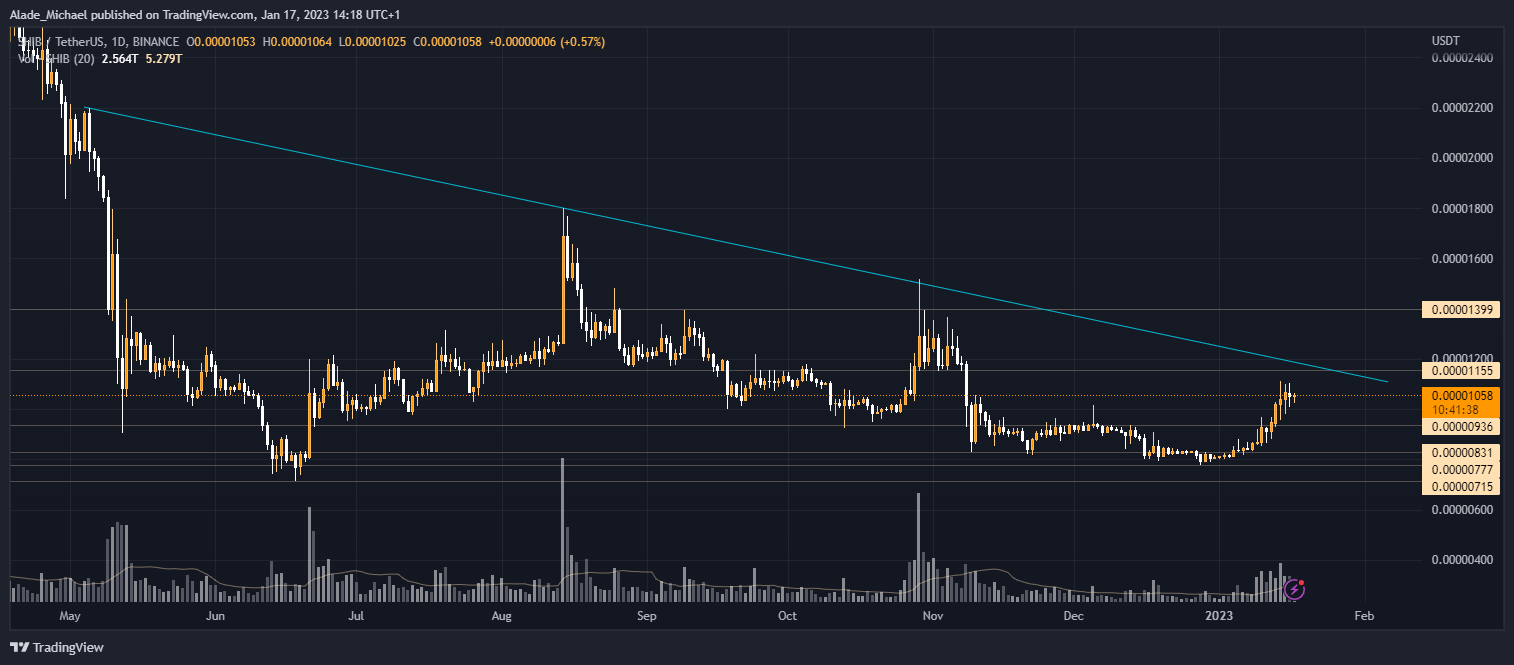
While volatility flows into the Metaverse chain, meme coin like Shiba Inu has remained calm following Dogecoin’s indecisiveness since last weekend. SHIBA is still up by 12% in a week.
Shiba Inu and other meme coins are yet to enjoy high volatility, like what we recently saw among the low-cap coins during this recovery period across the crypto space. Still, it managed to tap $0.000011 a few days ago.
Even though the recovery has been paused for the past few days, it is still trading well above the $0.00001 level ever since. Due to low volatility inflow, the cryptocurrency has failed to surge above the resistance line forming since May 2022.
The price seems to respect that line, which may continue to suppress buyers if the volatility keeps dropping. It may even lead to a more bearish action once the price drops beneath the mentioned trading level.
If Dogecoin can regain momentum from where it currently trades, we will start to see a significant increase in Shiba Inu’s price. The suppressing resistance line could break.
The most important thing is that Bitcoin needs to conquer more highs. The reverse will be the case if Bitcoin falls. However, Shiba remains under the bears’ radar despite the past week of increase.
SHIB Key Levels To Watch Out For

Shiba Inu can still spike to the resistance zone of $0.0000115 and $0.000012 before dropping. If buying volume increases from that zone, it could surge to $0.000014 above the resistance line before looking for a retracement level. The resistance levels to watch above it are $0.0000152 and $0.000018 in the future.
The important $0.00001 level currently serves as the weekly support. If Shiba loses this support, the closest level to consider as support is $0.00000936. it may also connect the $0.0000083 support level if sellers mount pressure. Below it lies breakdown levels at $0.00000777 and $0.00000715.
Key Resistance Levels: $0.0000115, $0.000014, $0.0000152
Key Support Levels: $0.00001, $0.00000936, $0.0000083
- Spot Price: $0.0000105
- Trend: Bullish
- Volatility: Moderate
Disclosure: This is not trading or investment advice. Always do your research before buying any cryptocurrency or investing in any services.
Image Source: moxumbic/123RF


